Some variables of the test data set SW_TEST_EFIA_PL_1B_20050716T000000_20050716T235959_0001_MDR_EFI_PL.cdf
have been plotted.
Descriptions of the plots are based on experiences with CHAMP or refer to literature.
Completeness of review is not guaranteed.

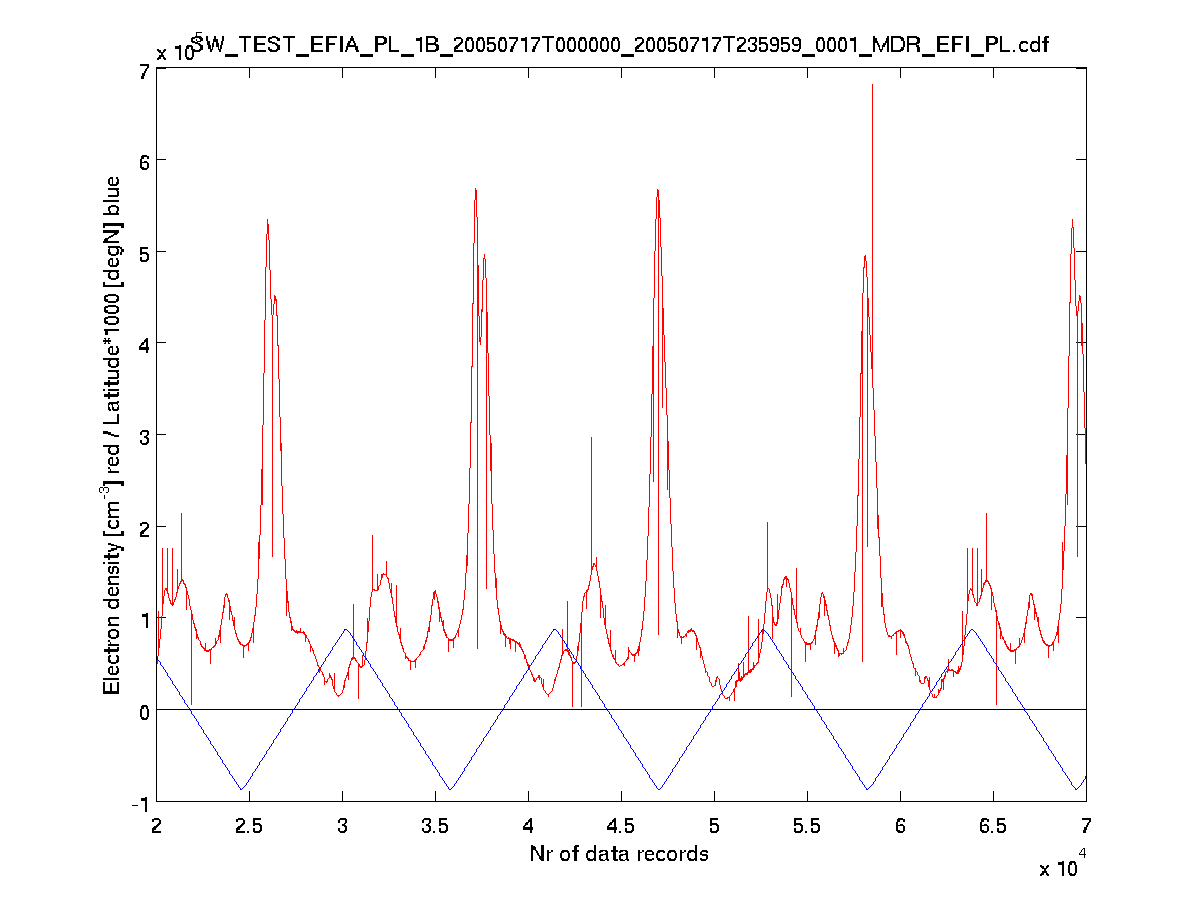
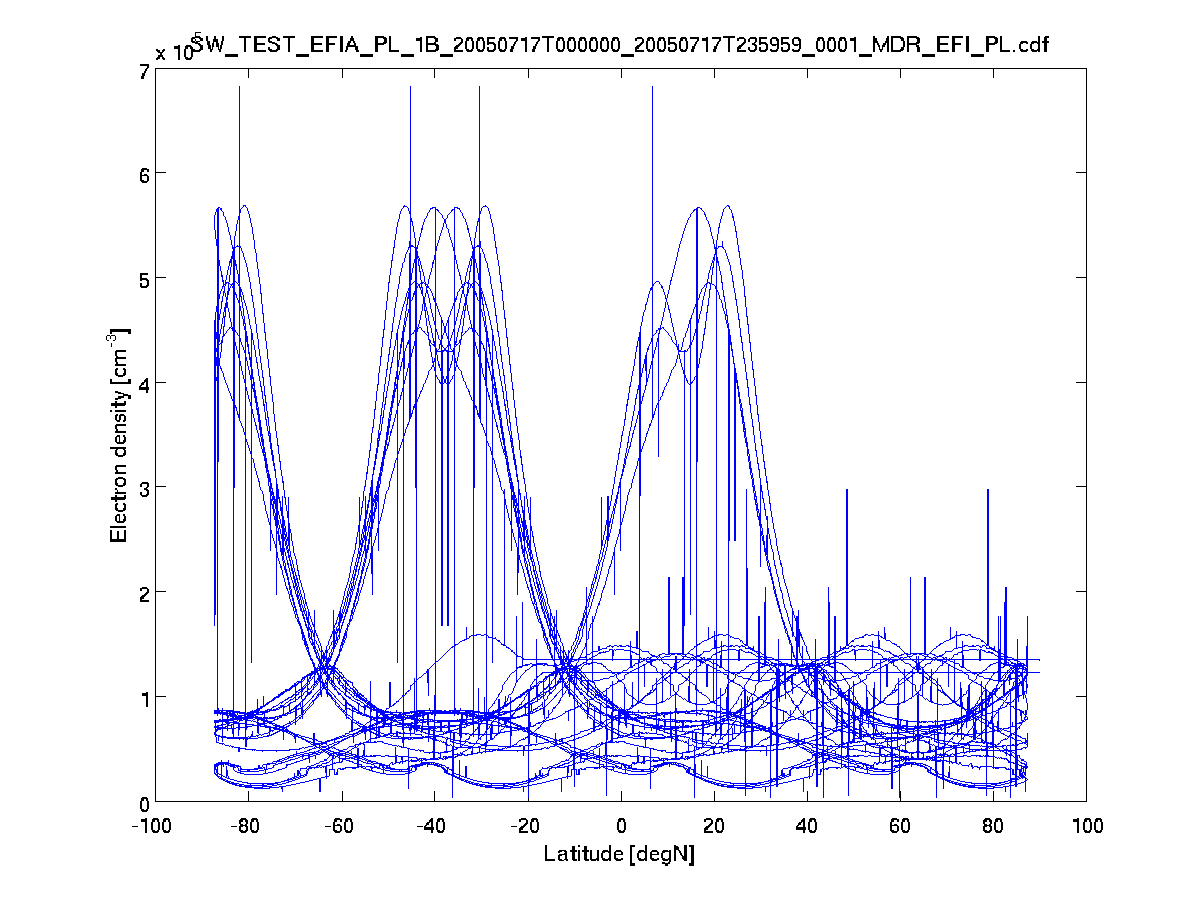
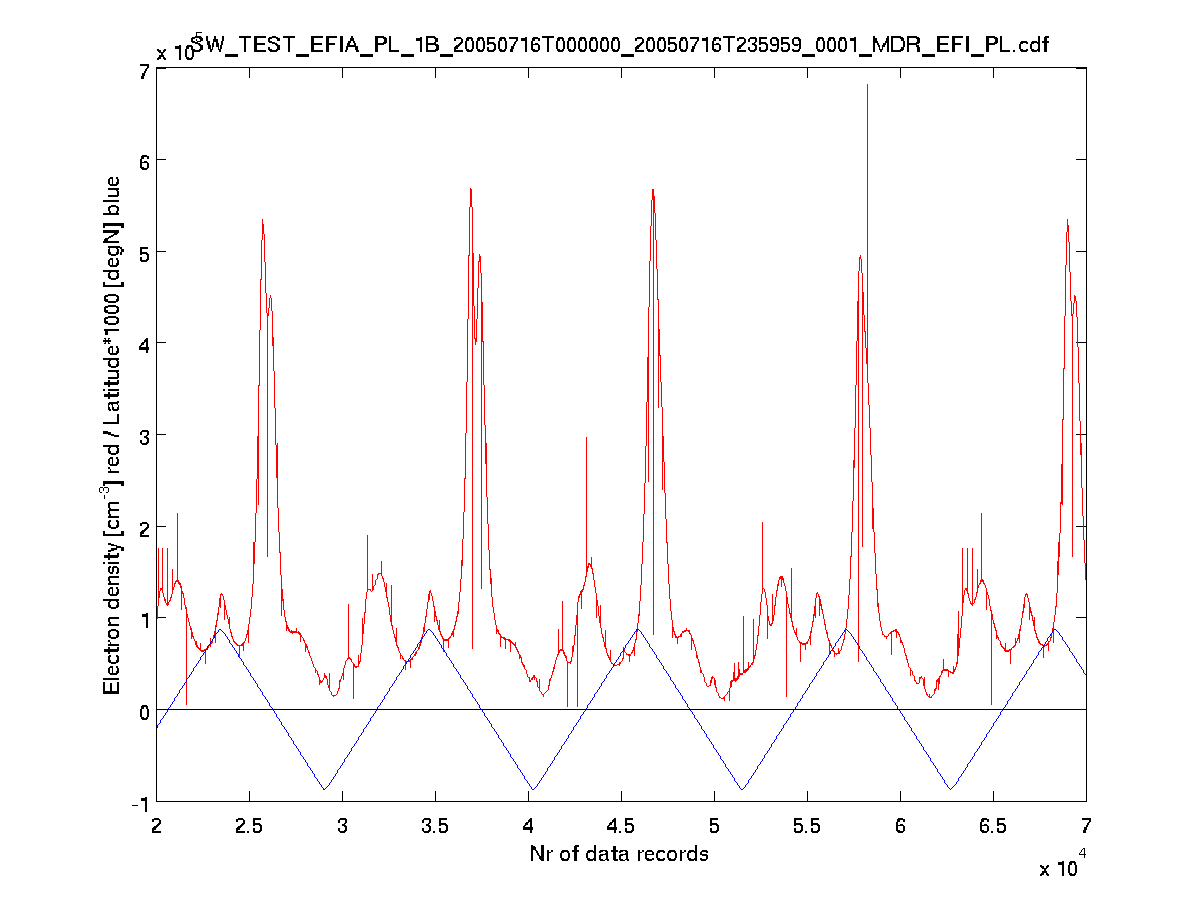
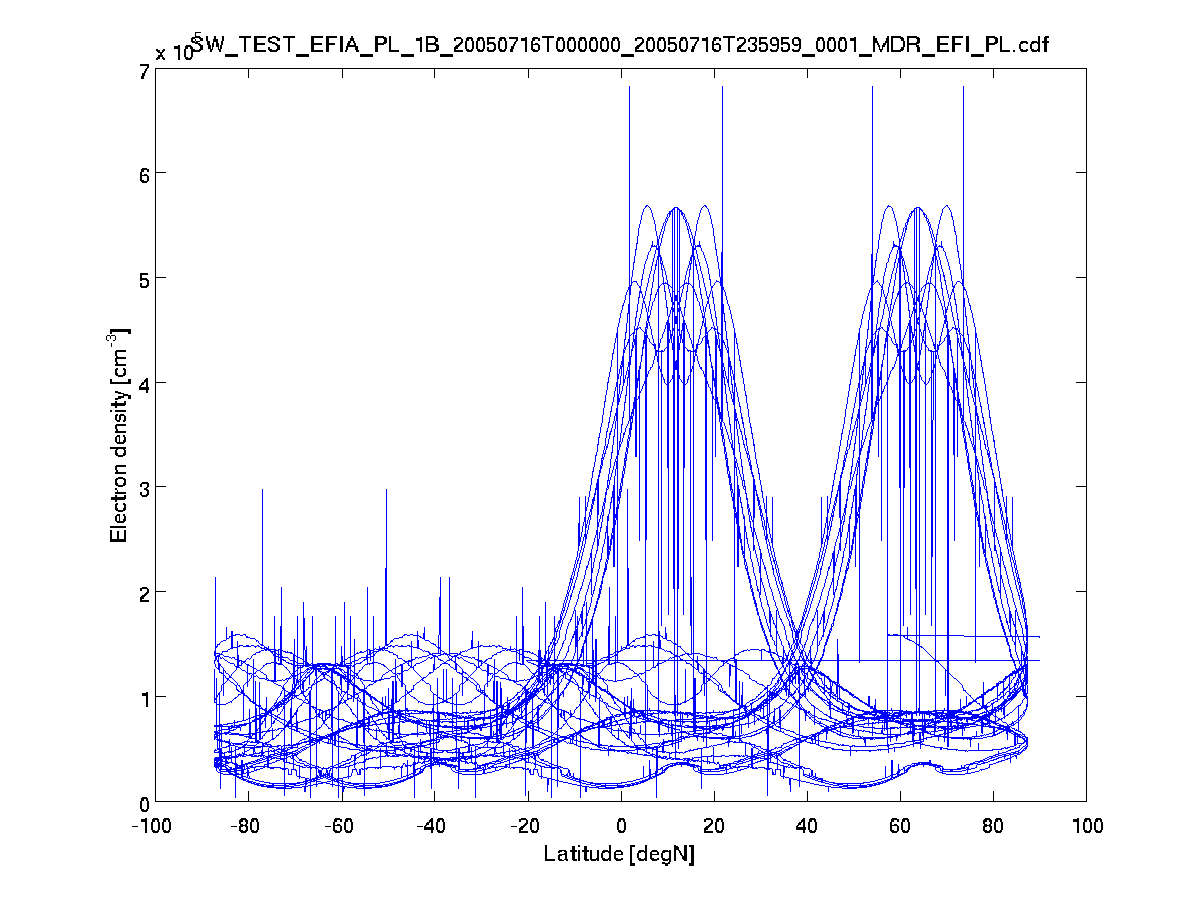
Plot2+3: Electron Densities are within the expected range. Highest values are expected around the equator (Equatorial Ionisation Anomaly). Plot2 and Plot3 shows that there are kind of anomalies near the equator, but there is also a kind of anomaly at 60 degree North. This is not physical. Please note also the random spikes.
Plot3 is simply a plotting of the electron density vector over the corresponding latitude vector in the file.
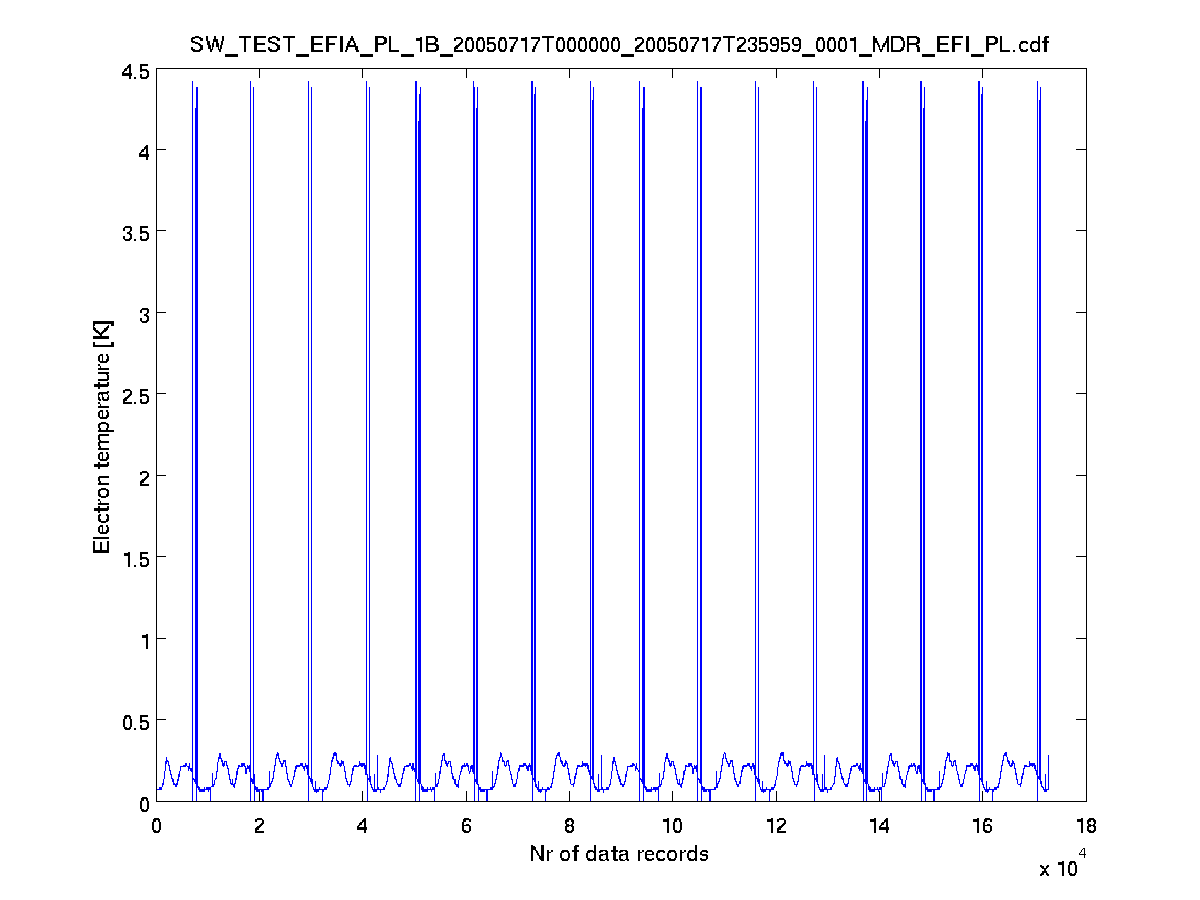
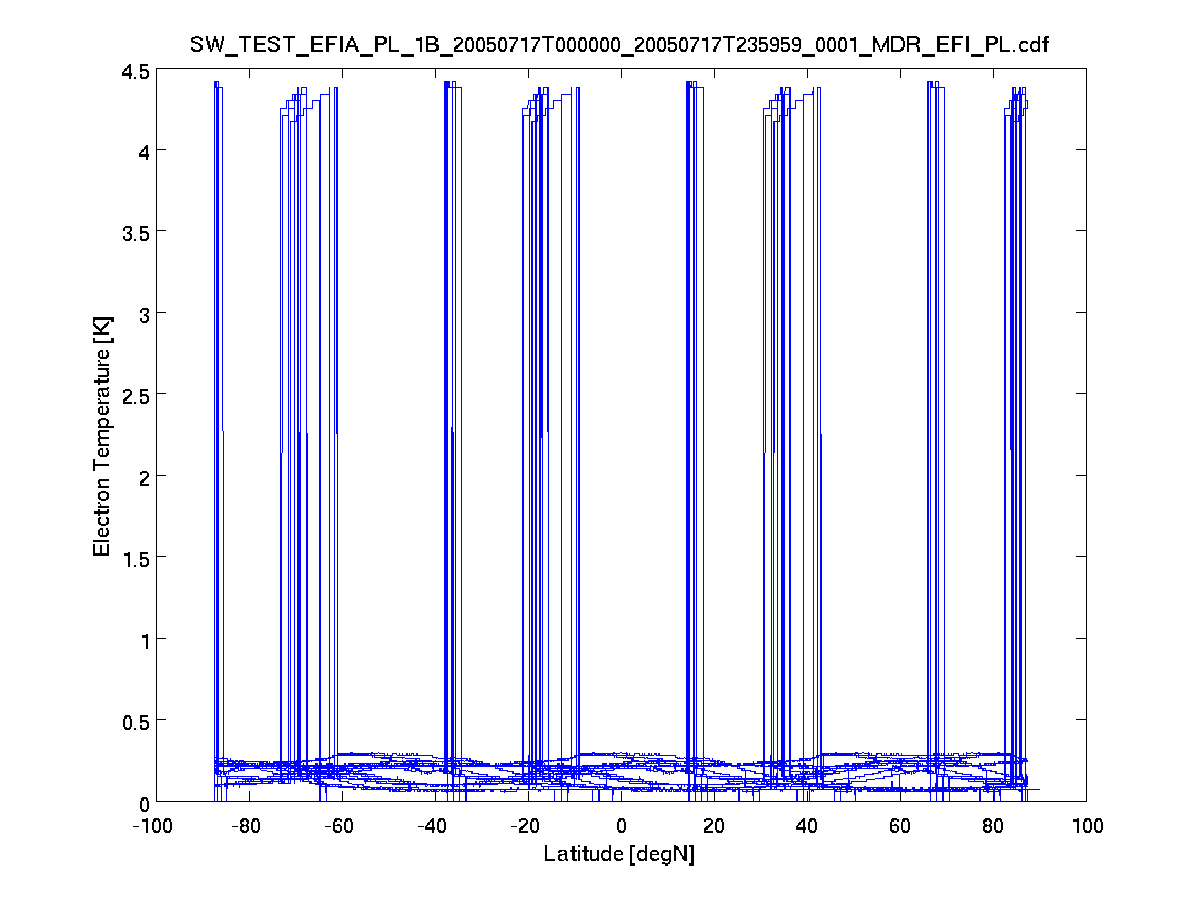
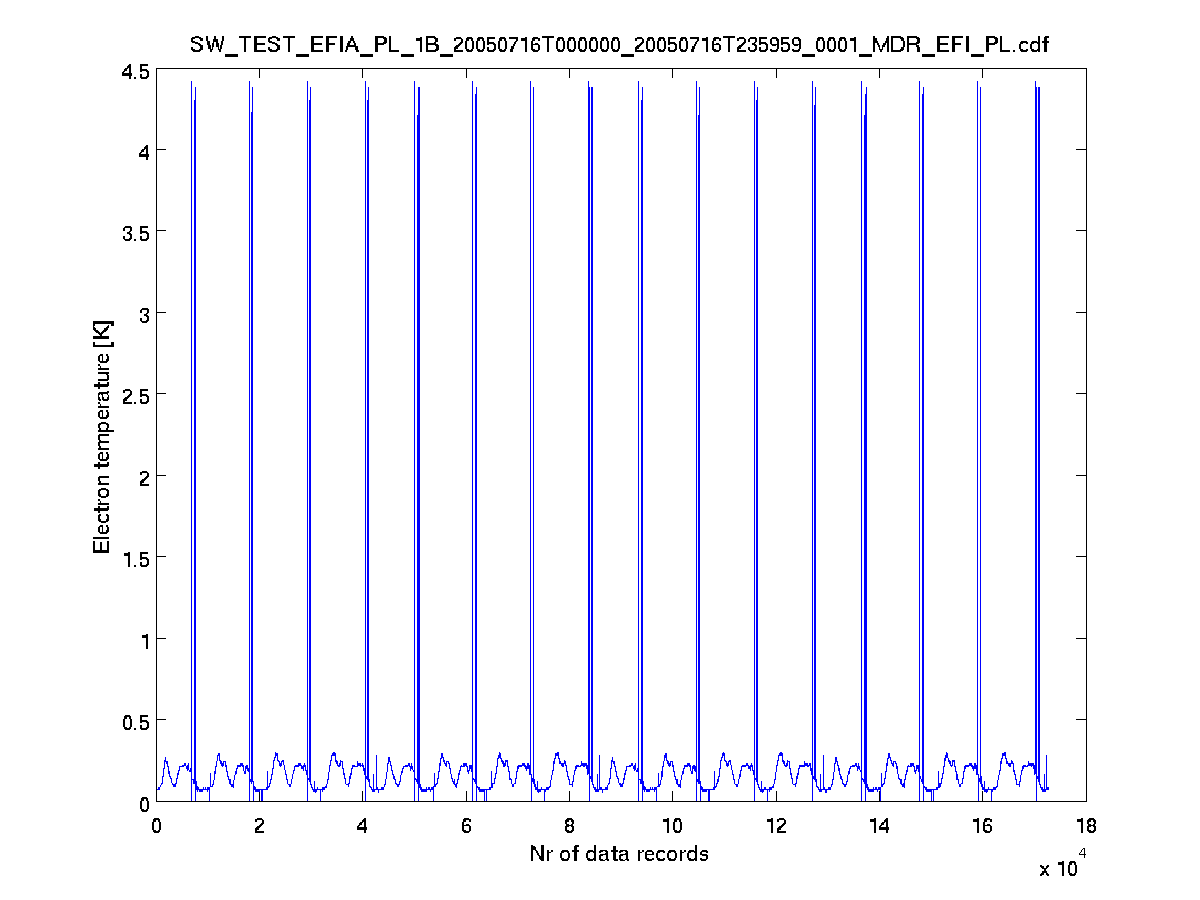
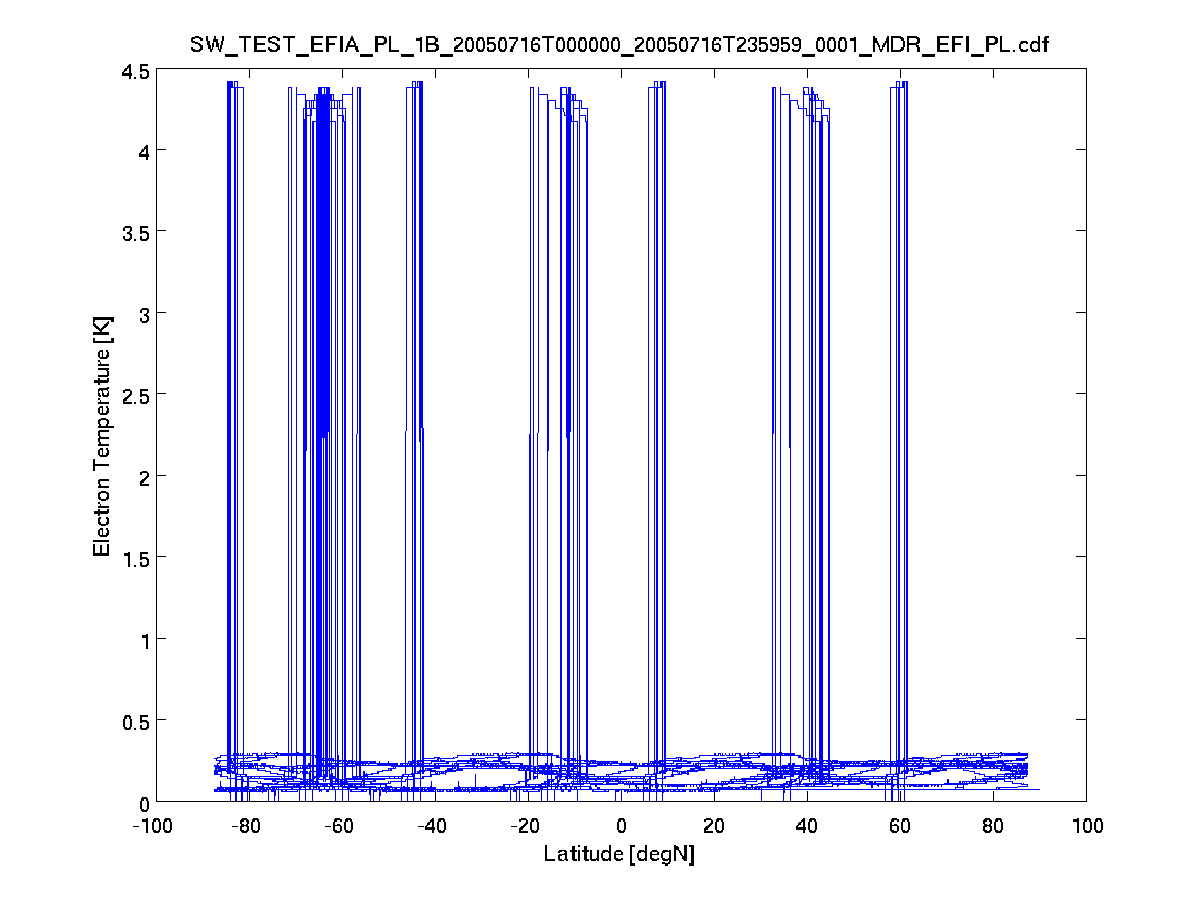
Plot4+5: Electron Temperature has natural magnitudes between 500 and 3000K during quiet times. The magnitudes in the file do not exceed 0.5K expect during regular spikes where values reach 4.5K.
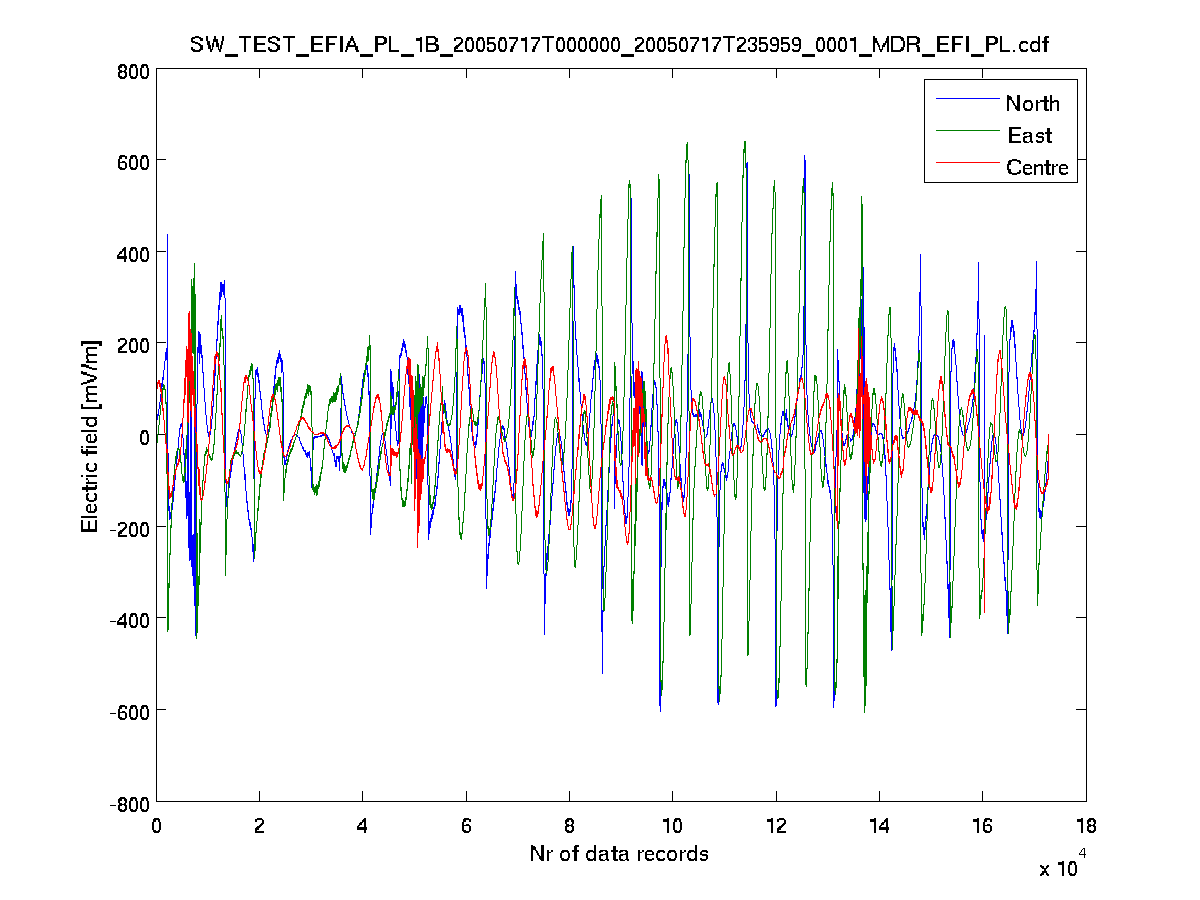
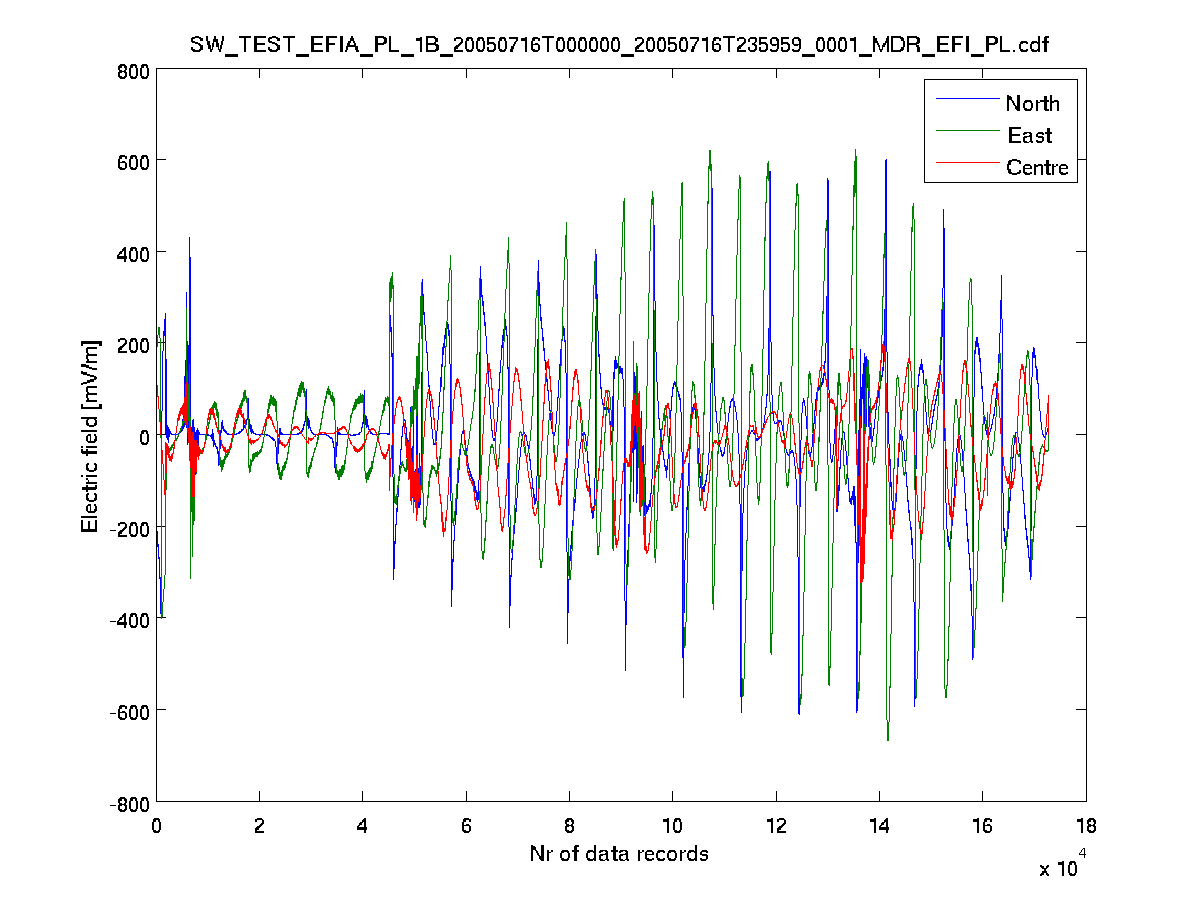
Plot6: The Electric Field changes largely with UT in the testdata set. This seems unreasonable, since Swarm should be in similar local times during one day.
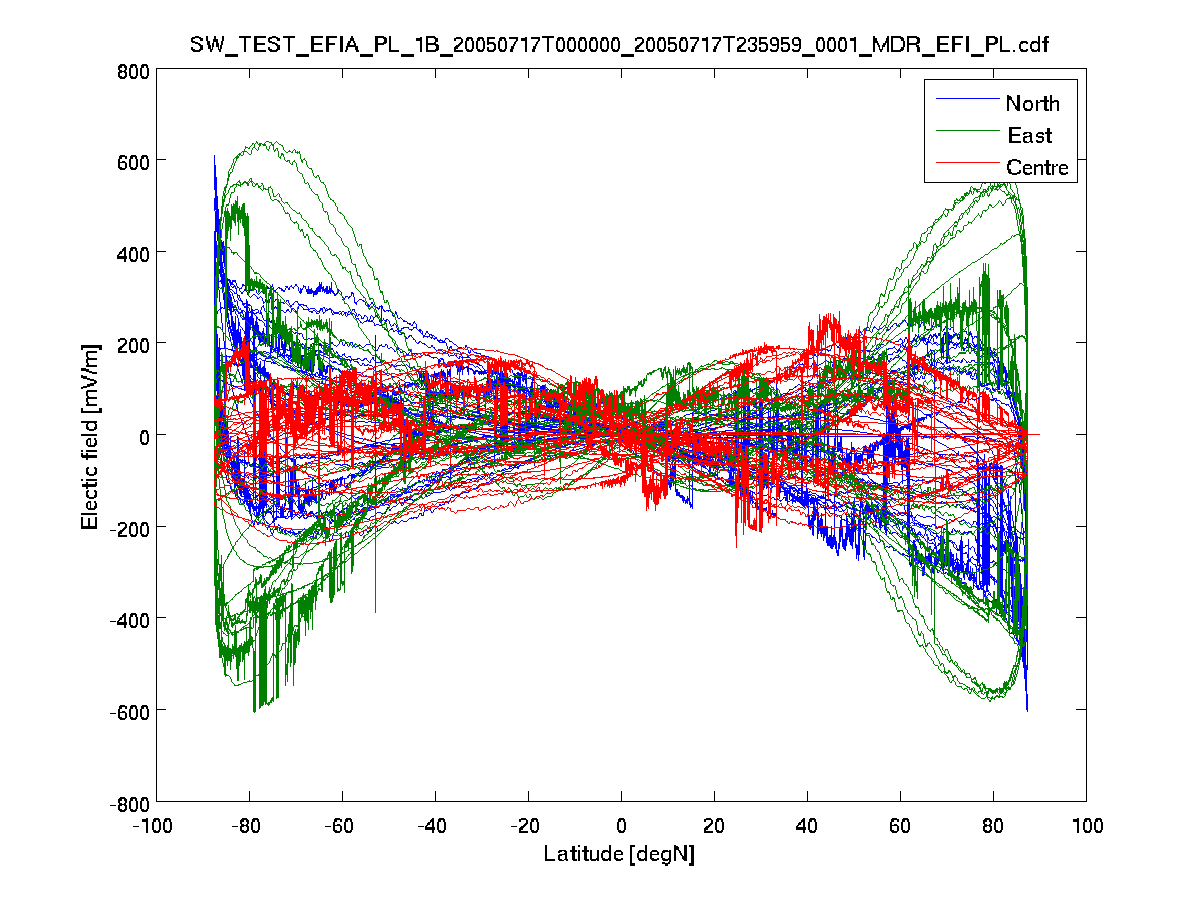
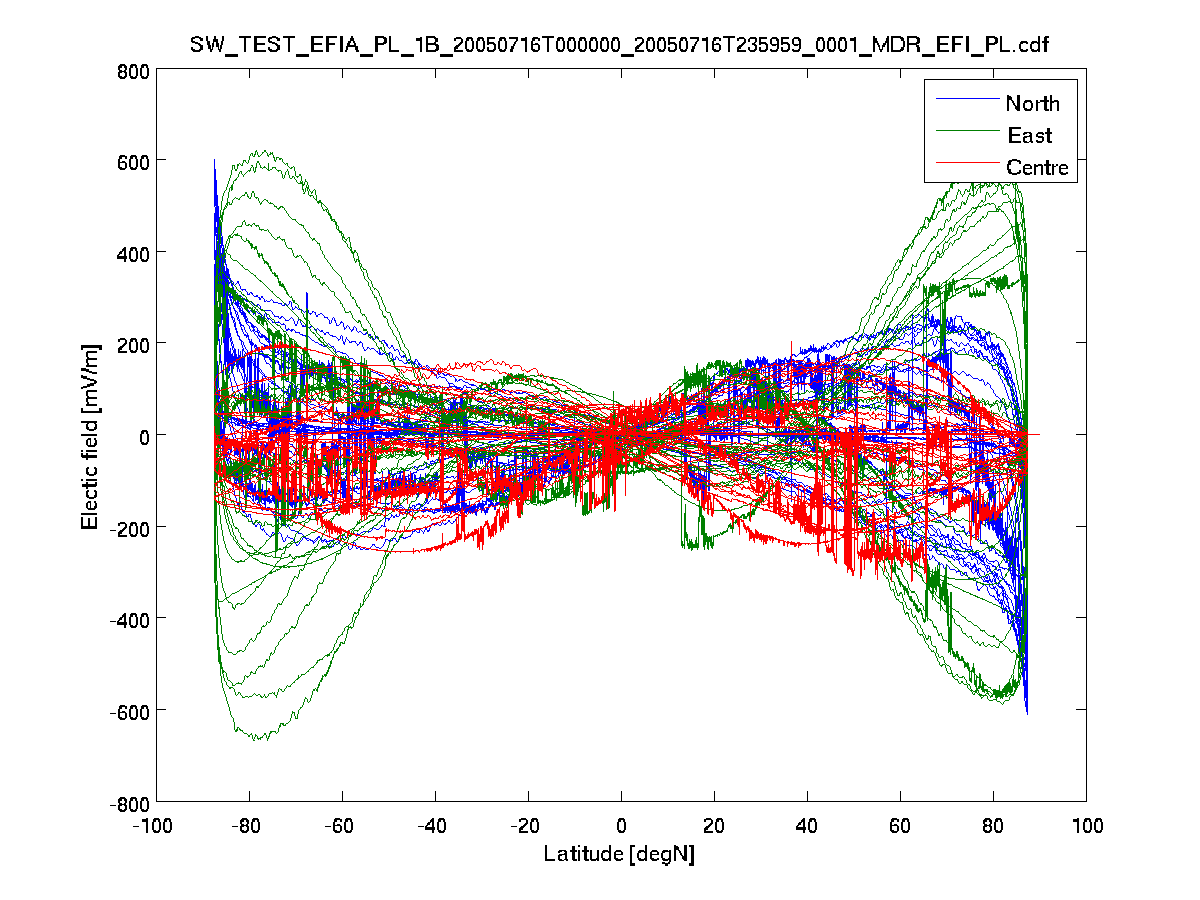
Plot7: Electric field: The distribution is ok (low at equator, high at high latitudes), but the magnitudes are probably too high. The literature suggest up to +/-100 mV/m at polar latitudes, also accounting for some activity.
Refs:
Kelley, M.C., The Earth's Ionosphere: Plasma Physics and Electrodynamics, 2nd edition, Elsevier, London, 2009.
Prölss, G.W., Physics of the Earth's Space Environment - An Introduction, Springer, 2004.
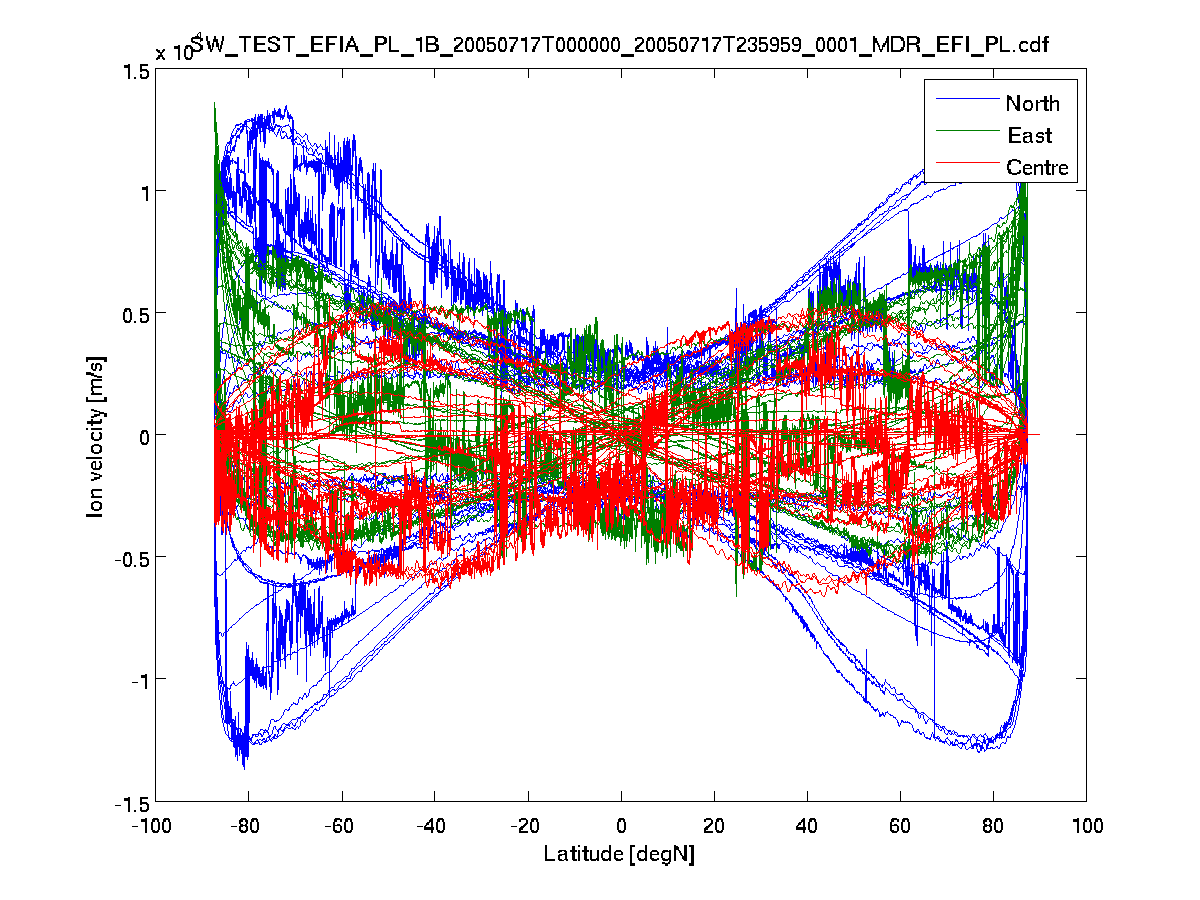
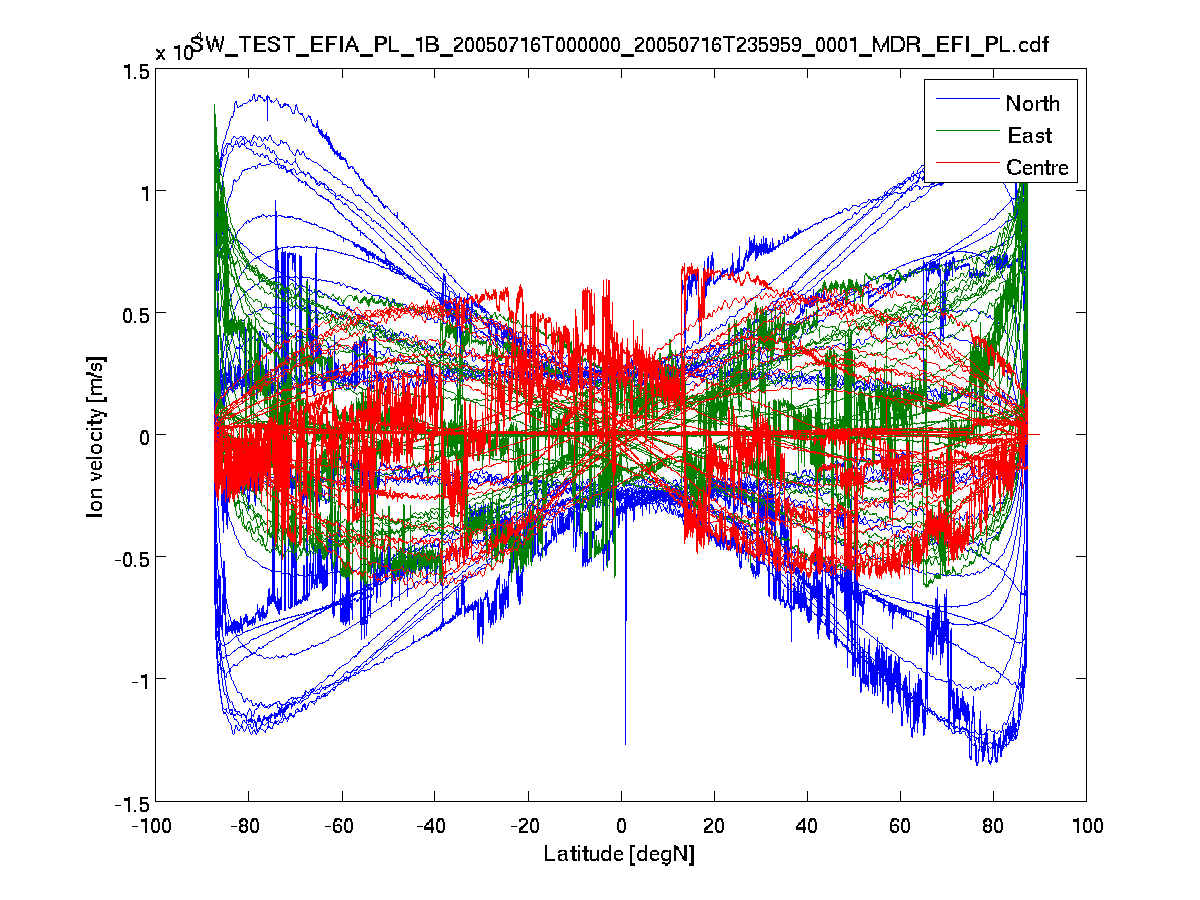
Plot8:
Ion Velocities is also lower at low than at high latitudes, which seems reasonable. Despite of that, it seems to be quite randomly distributed. The magnitudes in polar regions are similar to what found in the literature (up to 2000m/s). Low latitudes should show below 100m/s (eastward), and below 500 m/s (vertical). This significant difference in magnitude is not visible in the plots.
Refs:
Kelley, M.C., The Earth's Ionosphere: Plasma Physics and Electrodynamics, 2nd edition, Elsevier, London, 2009.
Lin, C. H., A. D. Richmond, J. Y. Liu, H. C. Yeh, L. J. Paxton, G. Lu, H. F. Tsai, and S.-Y. Su (2005), Large-scale
variations of the low-latitude ionosphere during the October/November 2003 superstorm: Observational results, J. Geophys. Res., 110,
A09S28, doi:10.1029/2004JA010900.
Foster, J. C., et al. (2005), Multiradar observations of the polar tongue of ionization, J. Geophys. Res., 110, A09S31,
doi:10.1029/2004JA010928.
Same plots but for 2011-07-17: