Comparison of the 2 x 24 hours data dated 16. and 17. July 2005
with 2 hour data scenario starting 15. July 2005 at 23:45 and
supposedly using the same scenario configuration shows a
number of similarities and differences.
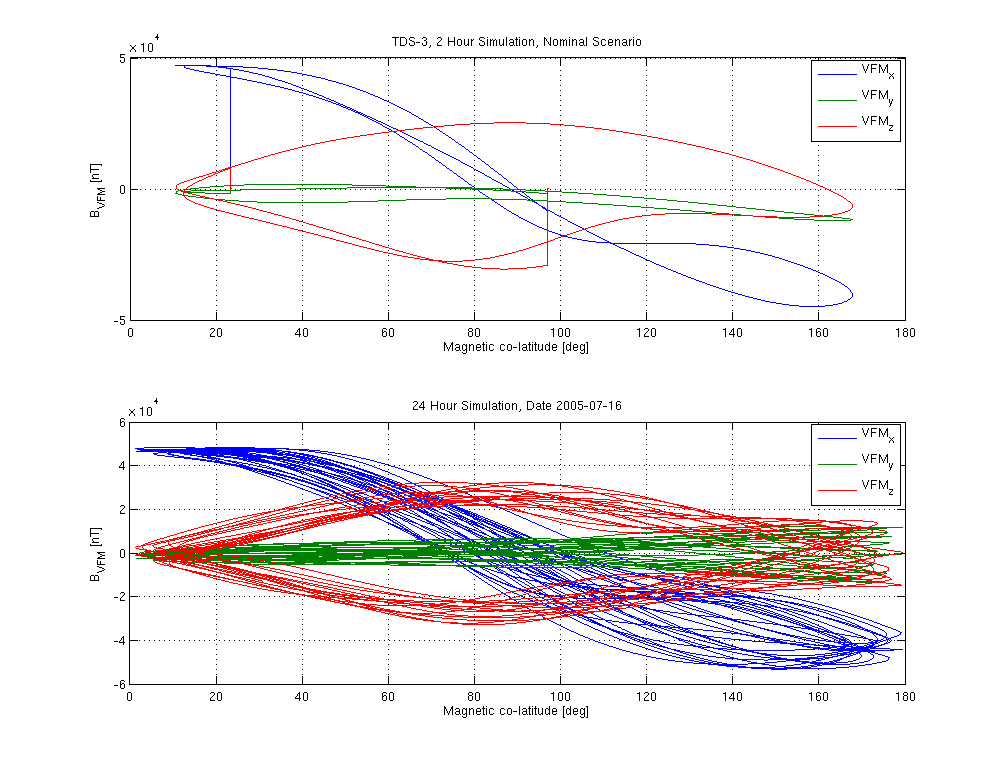
Plots of the field vectors in the VFM frame vs geomagnetic
co-latitude seem quite consistent - and (somewhat) reasonable:
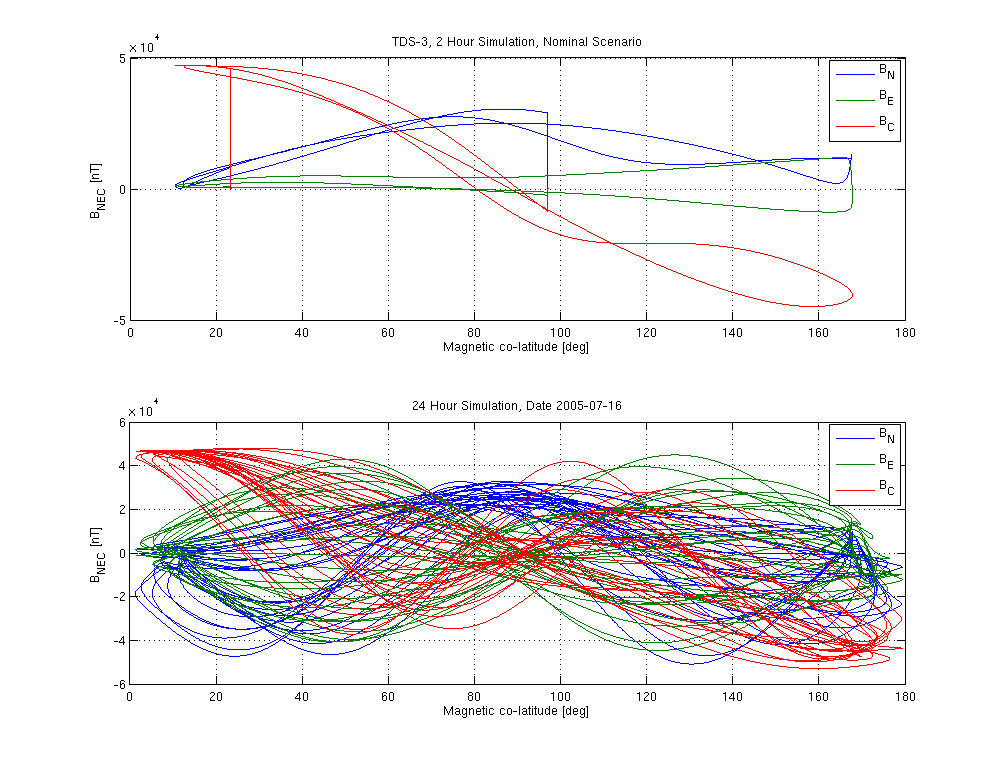
Plots of the field vectors in the NEC frame vs geomagnetic
co-latitude is shown next. The 2 hour simulation looks ok,
but the 24 hour data looks quite chaotic - though with clear
features similar to the 2 hour scenario.
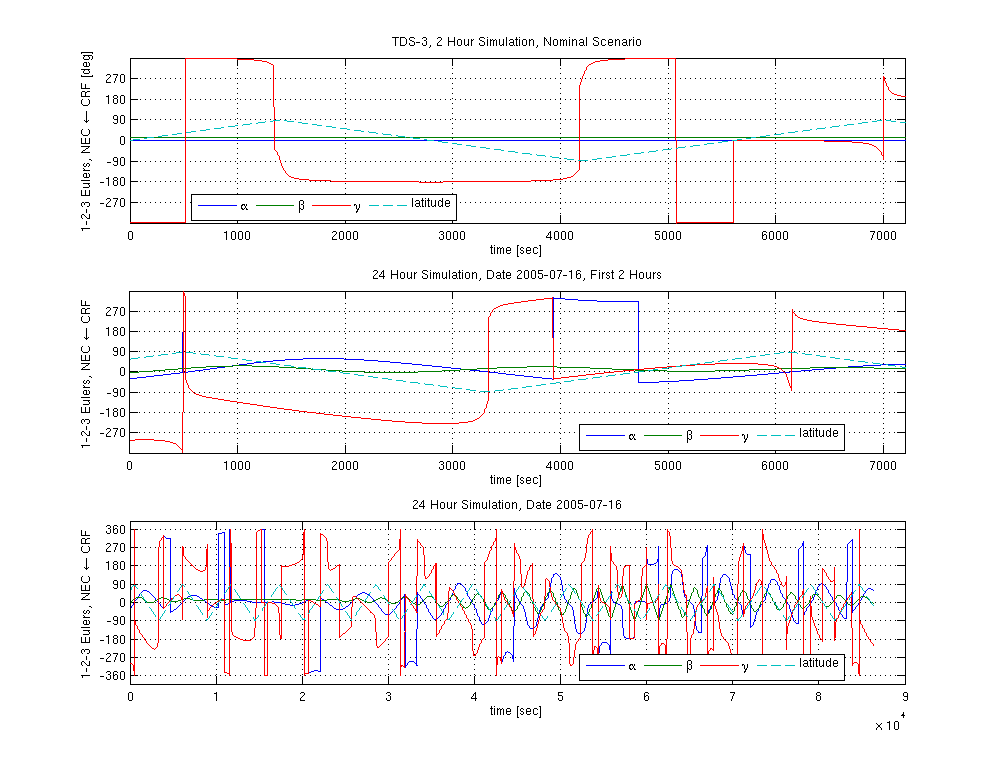
Finally plots of the rotations as 1-2-3 Euler angles from the Common Reference
Frame (CRF - which should be defined to be equal to the S/C
frame, but maybe not in the 24 hour data?) to the NEC frame is shown.
The top plot shows the 2 hour "reference" scenario, which shows an
expected semi-steady behaviour: no rotation going North, and a 180
degree rotation about z when going South.
The middle plot below shows the first 2 hours from the
24 hour data - here all three rotation angles are constantly
varying.
The bottm plot shows all 24 hours, which seem quite chaotic.
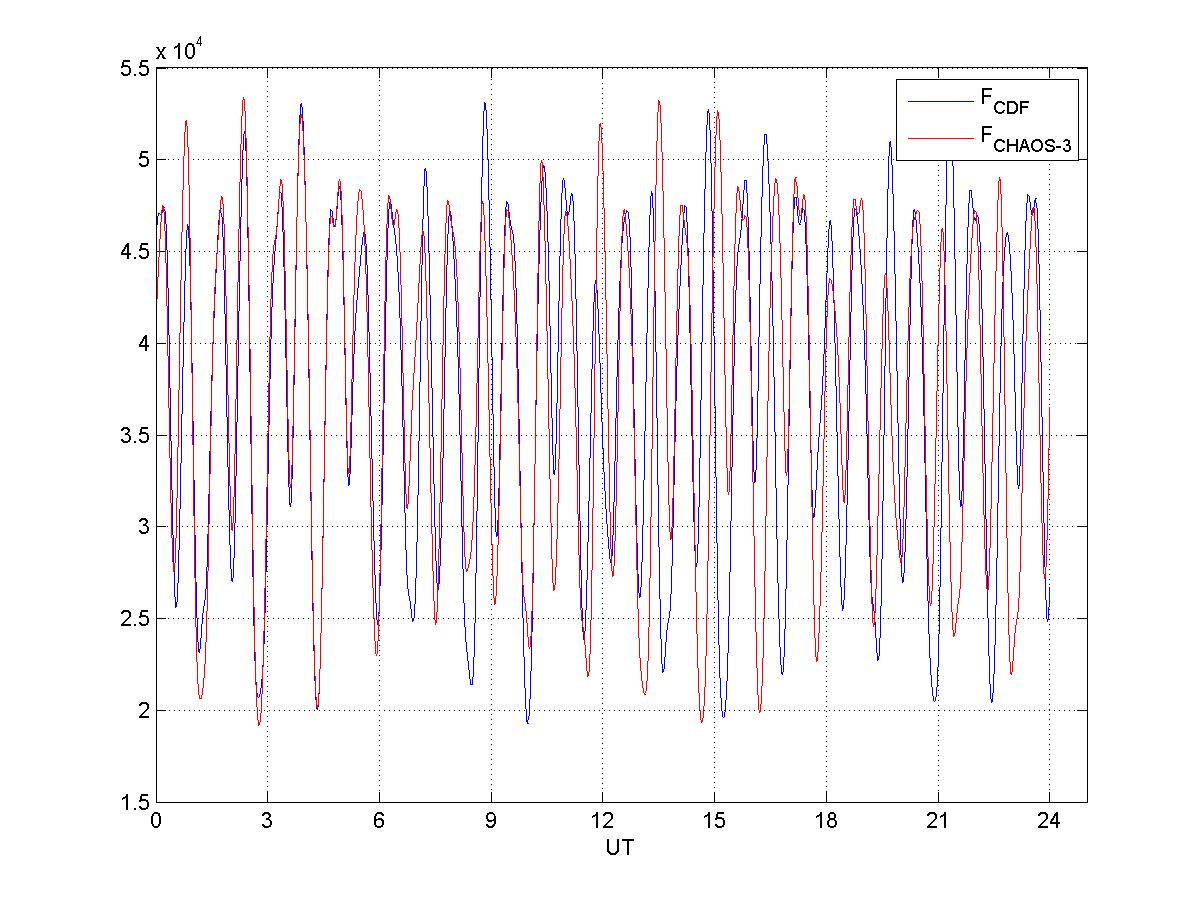
A plot of the scalar field together with the CHAOS-3 model
prediction is given below and shows significant differences.