Swarm dBSun Issue 2022, Report 2022-03-02
Progress since 2022-02-23
Magentic data from all three Swarm spacecraft have been recalibrated
using the methodology agreed on the online meeting Friday 2022-02-25,
i.e. modeling the y-component of dBSun,VFM as a scaled
version of the x-component (of dBSun,VFM).
A residual part of the y-component has been co-estimated with significant
damping primarely to avoid contamination of the estimated y-cpomponent
of both dBSun,VFM and dBSun,ASM.
This residual part is to be ignored in the processing of Swarm magnetic
data version 0602.
Scalar Calibration for Version 0602
Swarm Alpha
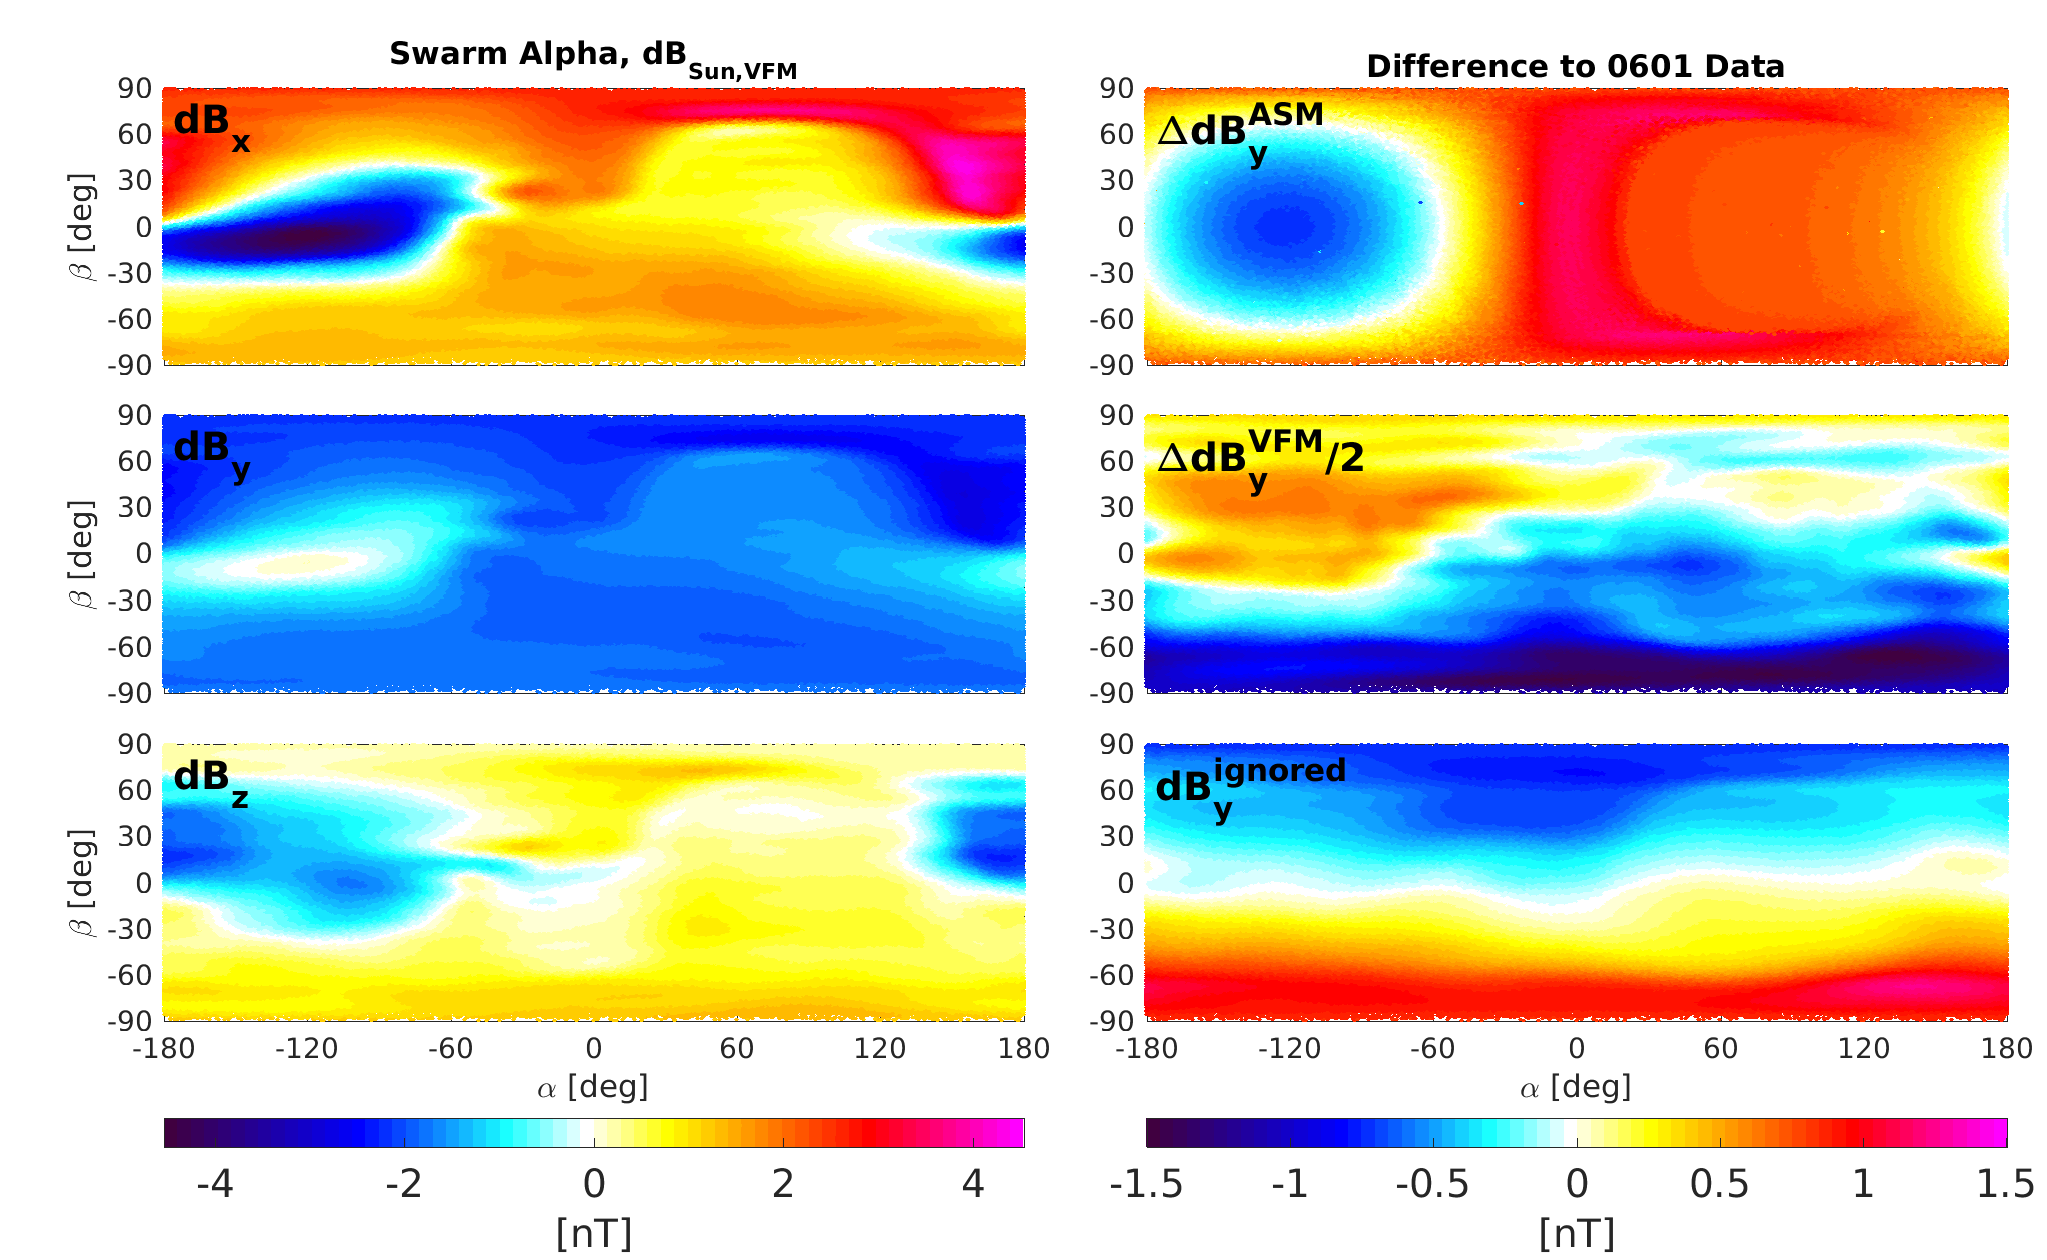
The following figure shows the estimated dBSun for Swarm Alpha.
On the left are the three components of dBSun,VFM (excluding the
residual part of y), and on the two top right plots are shown the difference
in the y-component of dBSun,ASM and dBSun,VFM
respectively compared to Swarm data version 0601.
The bottom right plot shows the estimated residual part of the y-component
(which is ignored in the processing of 0602 data).
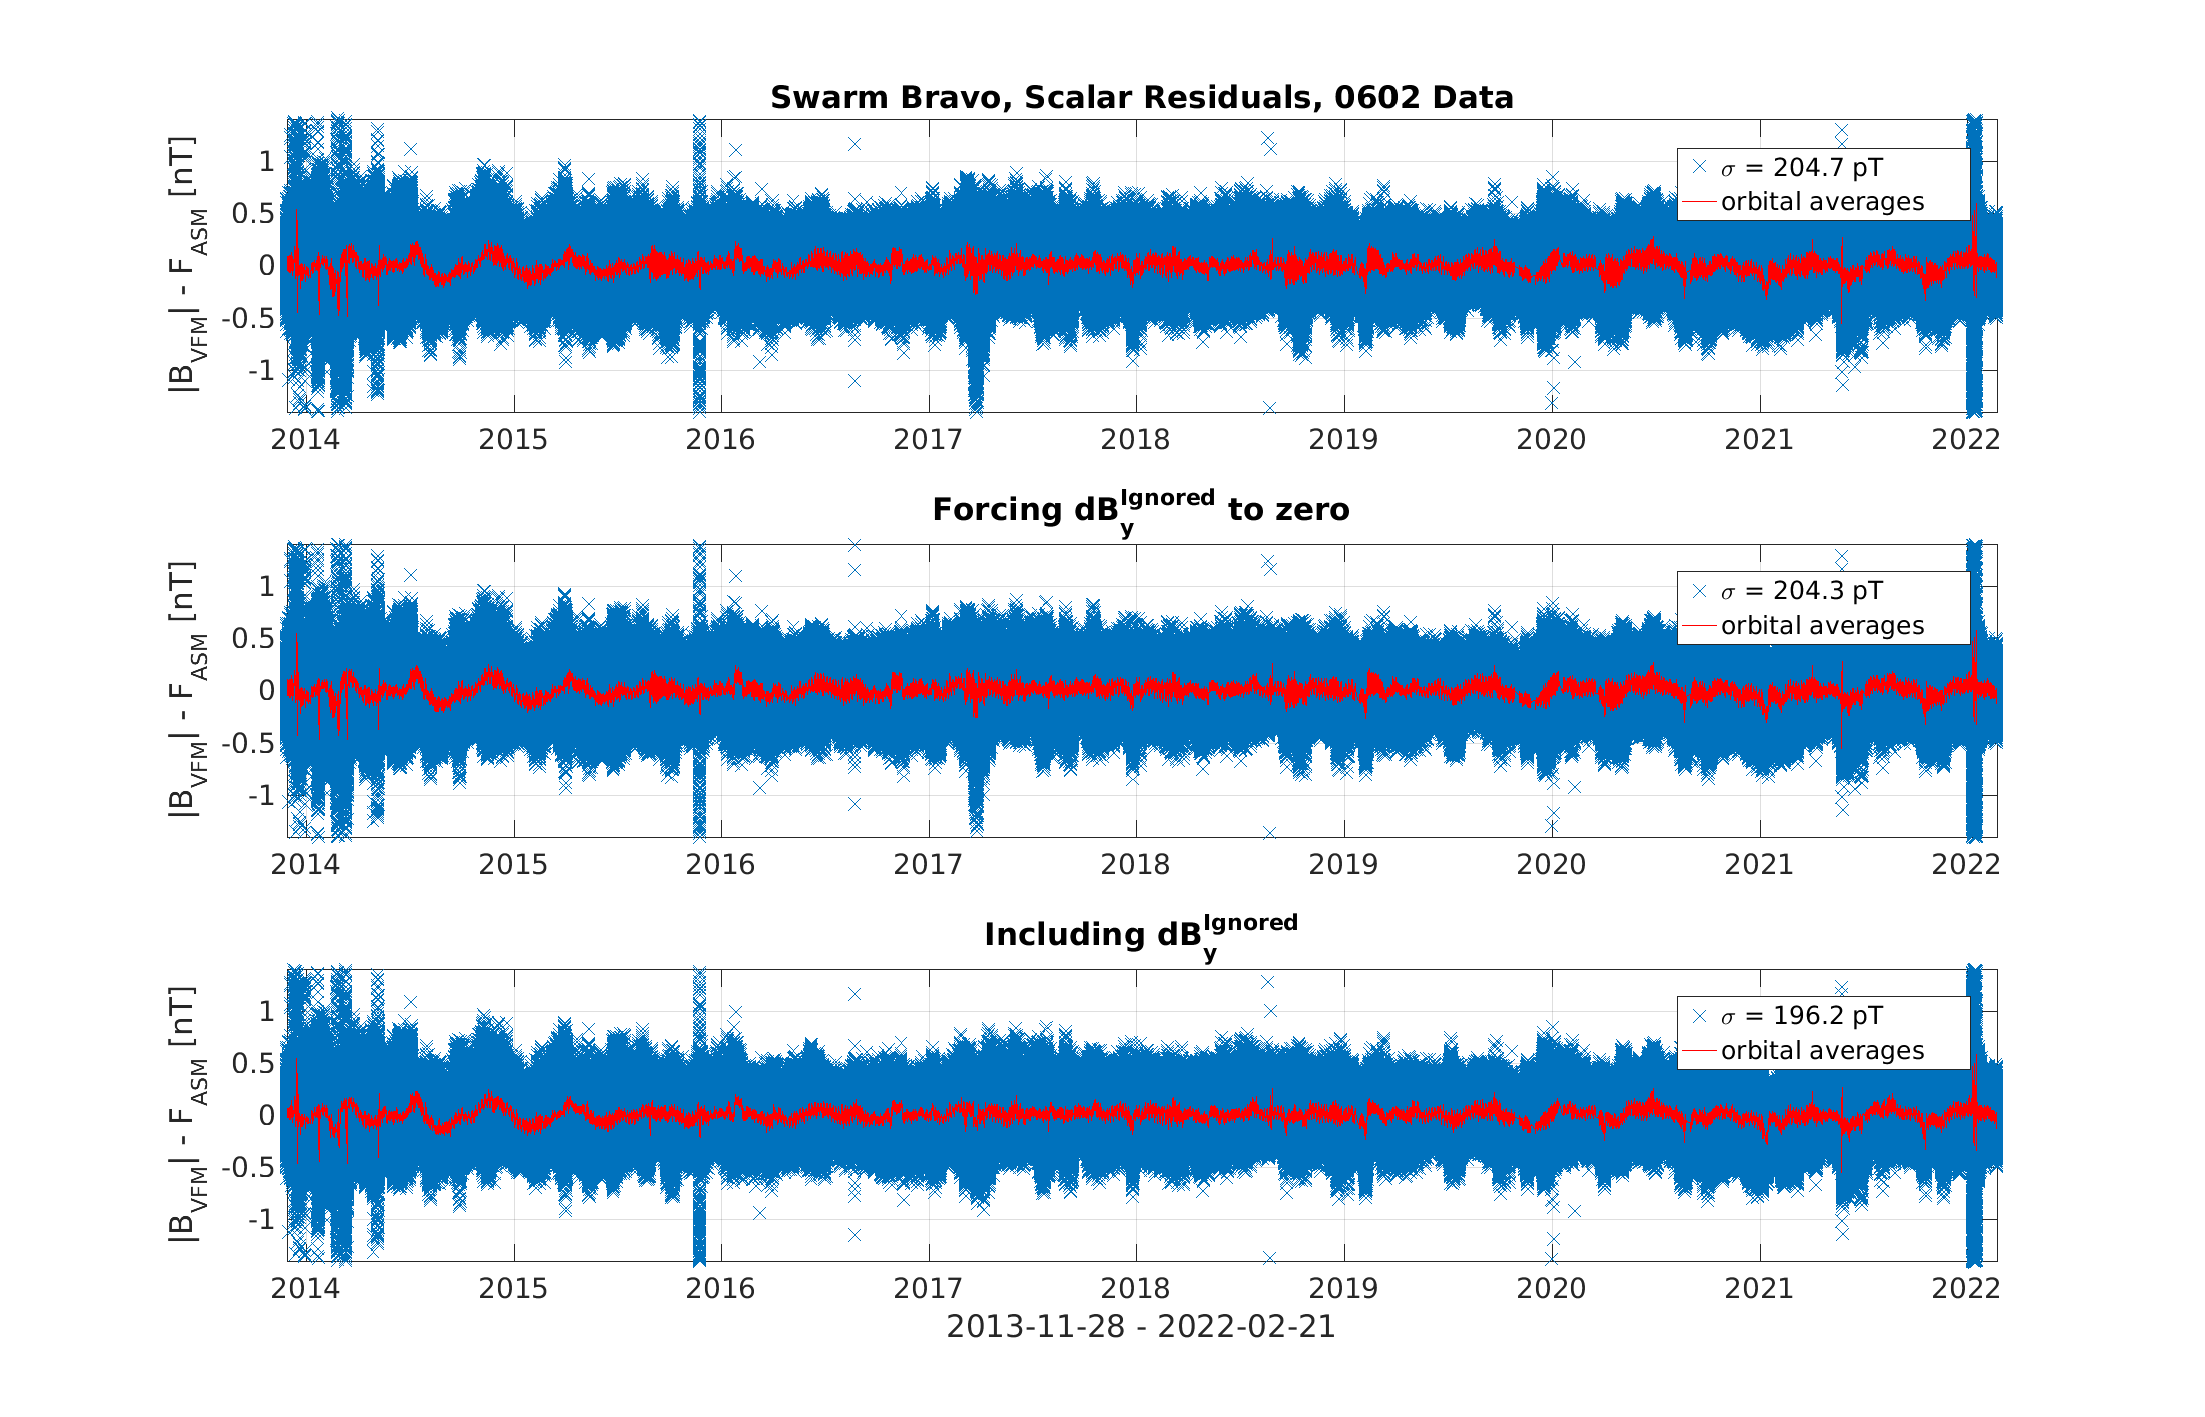
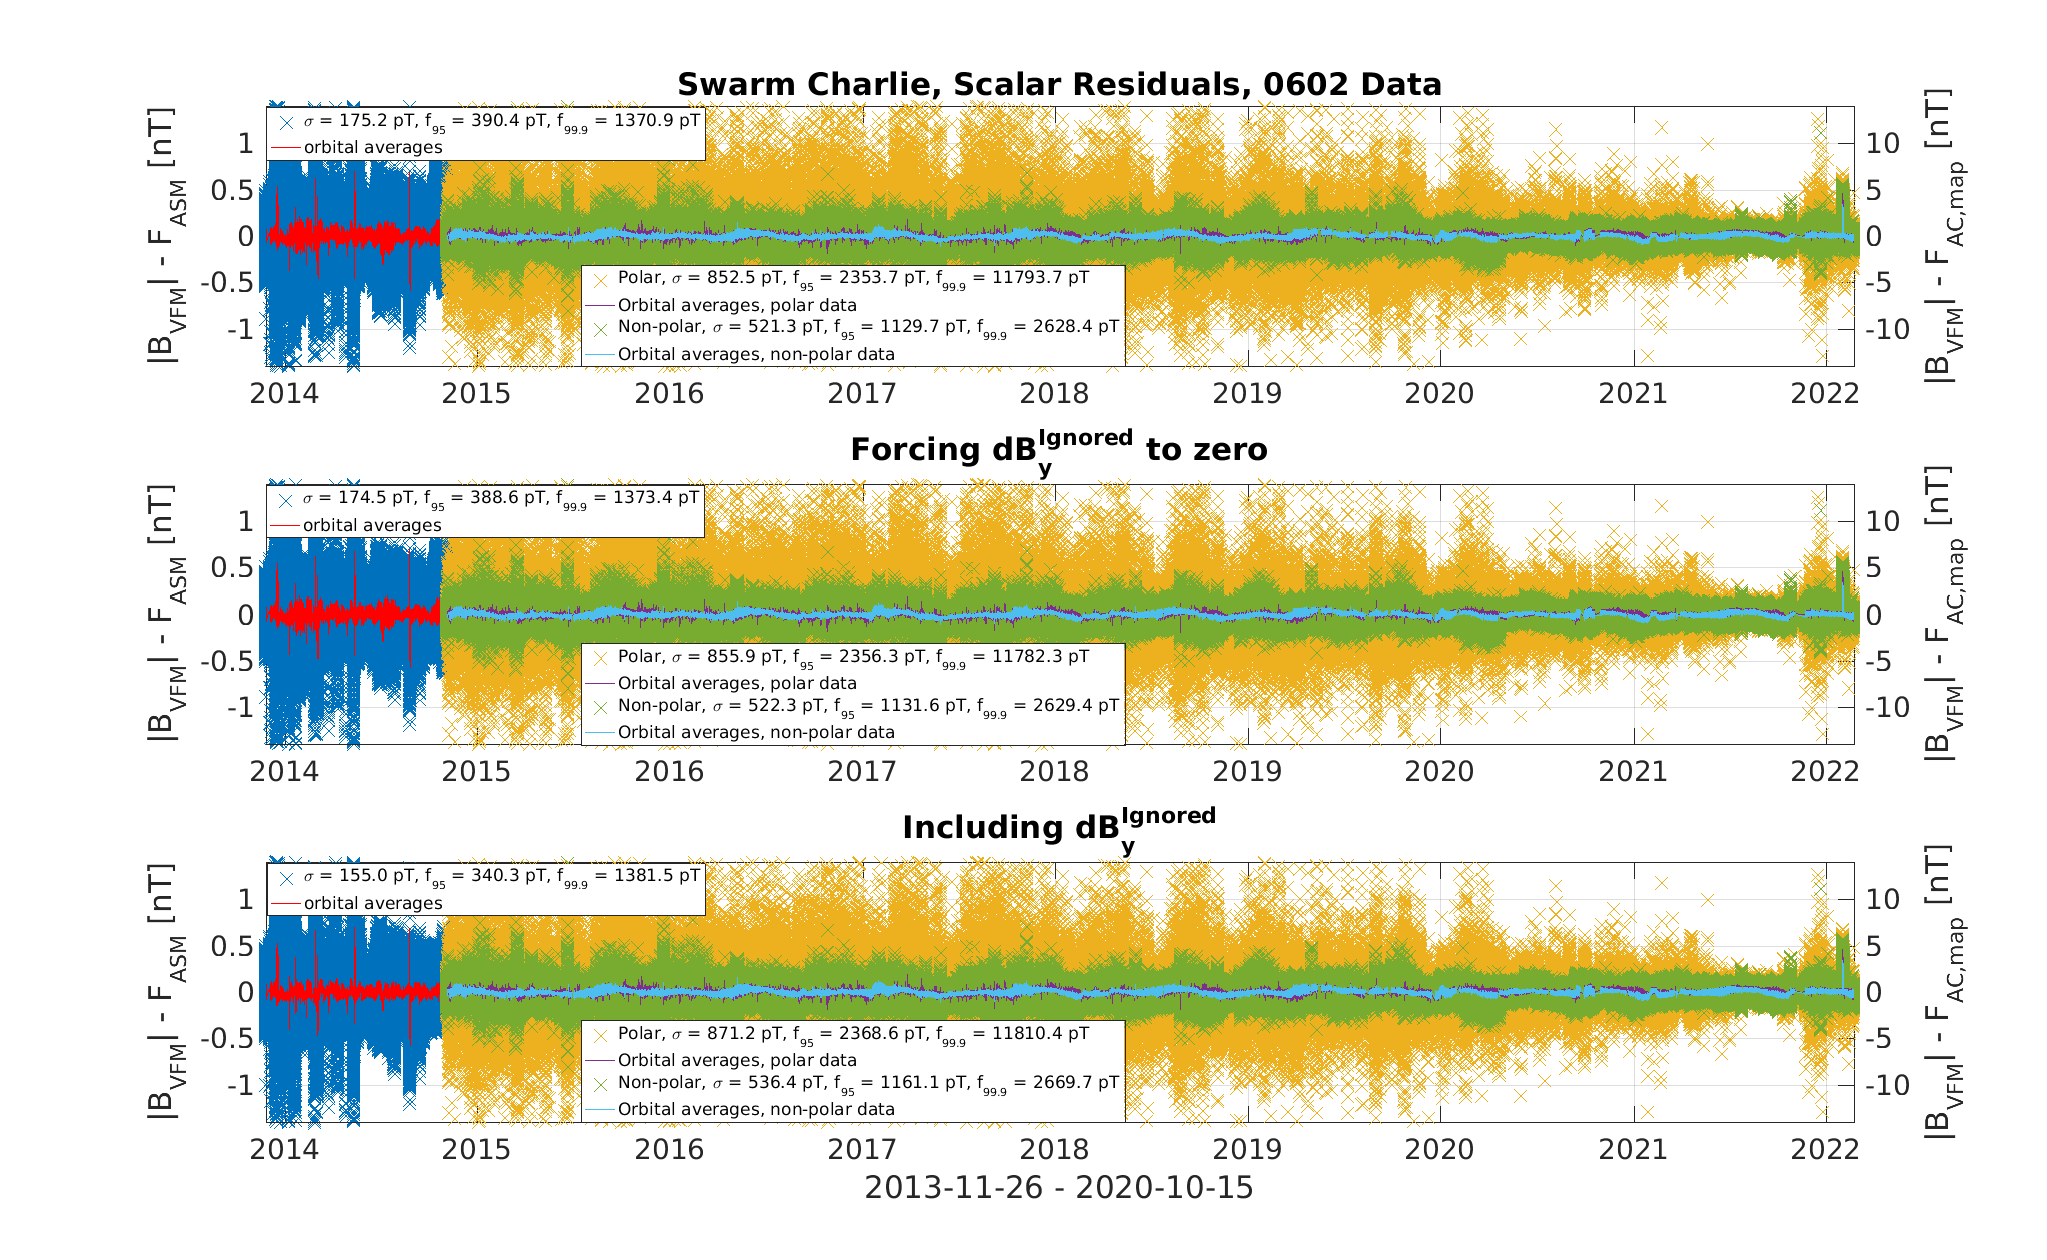
The following plots show the scalar residuals for Swarm Alpha.
The top plot shows the residuals for the 0602 data;
the middle plot shows the residuals if the residual part of y is not
co-estimated (forced to zero), and the bottom plot shows the residuals
if the residual y-component were to be including in the processing.

Swarm Bravo and Charlie
The correponding plots for Swarm Bravo and Charlie are given next.


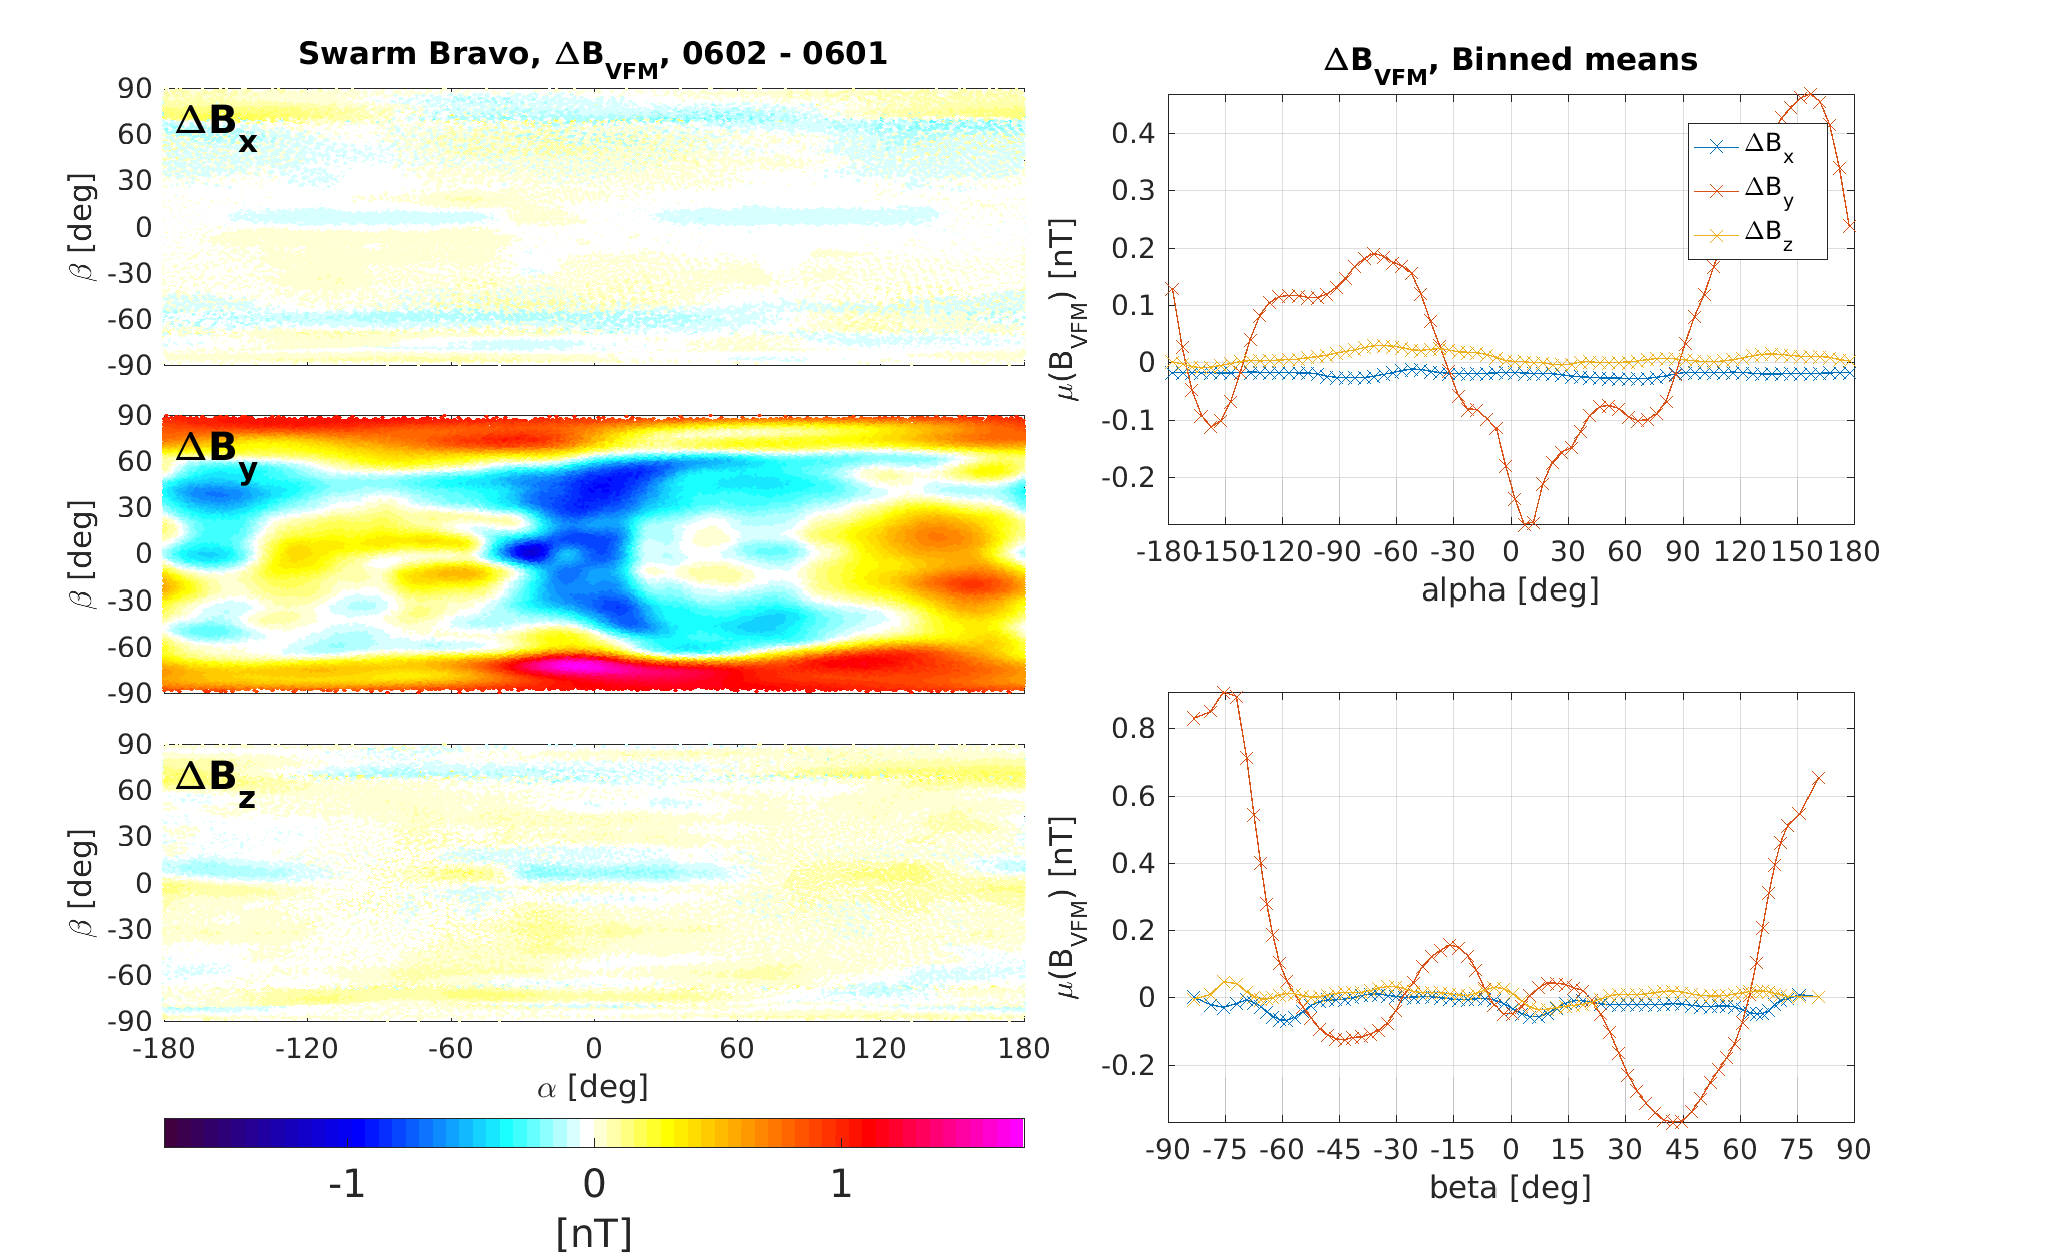
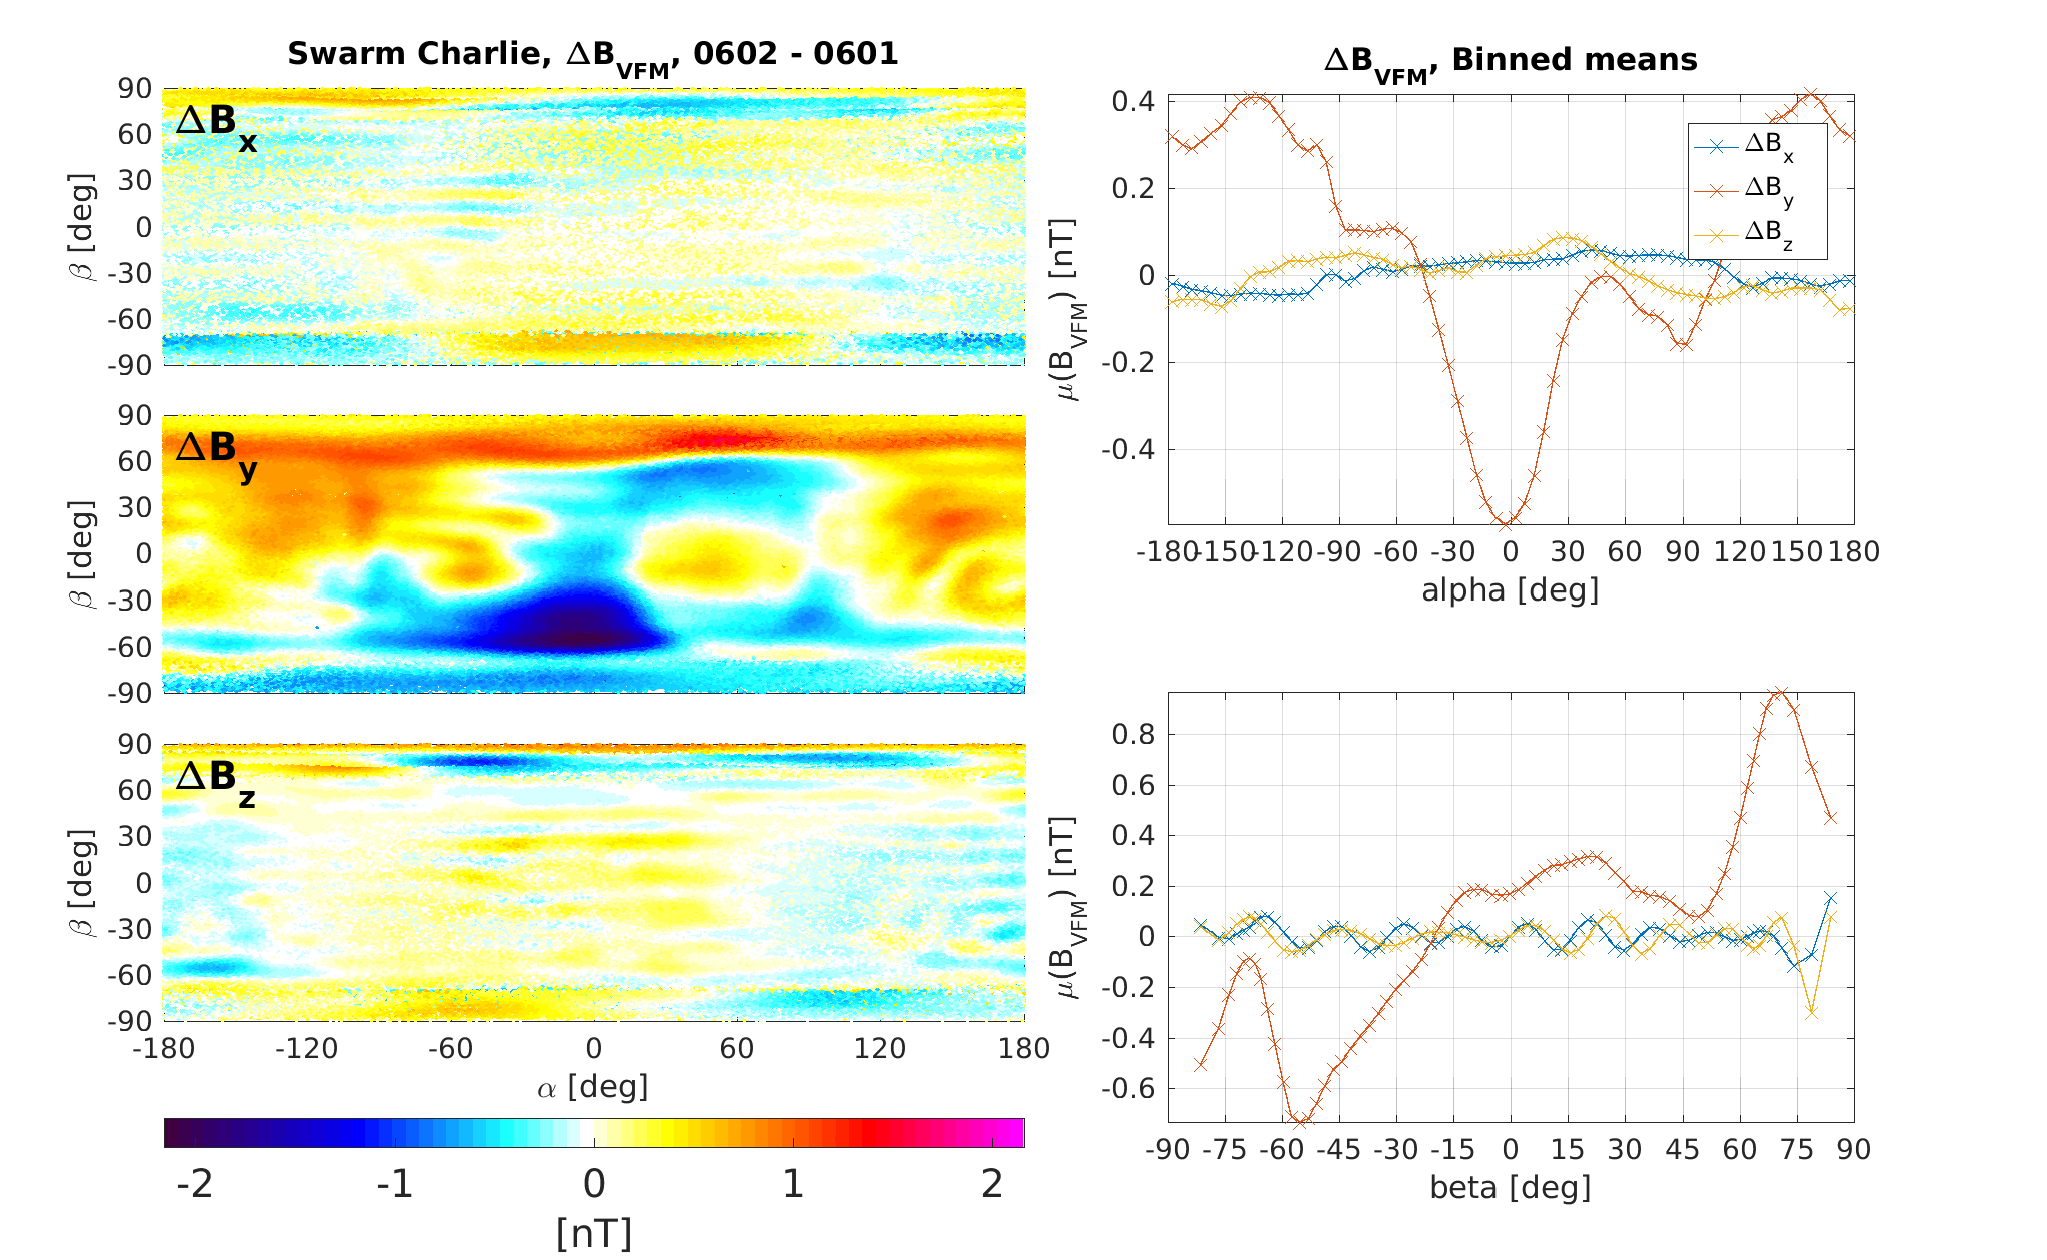
Comparison of BVFM Between Version 0601 and 0602
Below are plotted the difference in BVFM between Swarm
data version 0601 and 0602. On the left are maps of the three
components in the Sun incident angles alpha and beta.
On the right, the differences are binned according to these two angles
and the means of ΔBVFM are plotted.
Comparing the mean differences binned wrt the beta angle to the
mean residuals of the Comprehensive Inversion (CI) binned in the
same way, SW_CIY7_dBy_beta.png
the changes from version 0601 to 0602 seem fair in compensating the
CI residuals.
.

Difference in Alpha-Charlie Difference
Ultimately, the double difference, i.e. the difference between the differences in
BVFM of Alpha and Charlie, are shown in the following figure.
Notably, the map δΔBy has some agreement with the
maps of Nils, cf dB_2_2014-2021.png.
The map on the right shows the difference between δΔBy
and a spherical harmonic model of Nils' results ("vector mapping").
As can be seen, some of the features revealed by Nils have been removed, mainly
the large positive (red on the δΔBy map to the left) part for
negative values of beta. The red parts on the right map for beta between 0 and ~65
degrees (blue in Nils' plots) bear some resemblance to dByignored
for Swarm Charlie (see above), but this has other features not seen in the right-hand
side map below, hence for now this is probably the best we can do.
